How Analytics and Site Metrics Work in Airo AI Builder | Built-in Dashboard
Your Published Site Has a Built-in Analytics Dashboard
You built and published your app. Now what? You need to know if anyone is actually visiting, where they’re coming from, what pages they’re looking at, and whether they’re engaging with your content.
Most no-code app builders either don’t include analytics at all or make you set up Google Analytics, paste tracking scripts, or connect a third-party tool. Airo AI Builder has a built-in analytics dashboard. Publish your site, open the Analytics tab, and your data is already there. No setup, no extra tools, no code snippets.
Watch the full walkthrough:
This guide covers what the analytics dashboard tracks, what each section tells you, and how to use the data to grow your business.
What the Dashboard Tracks
Once your app is published, the analytics dashboard starts collecting data automatically. Here’s the full overview:
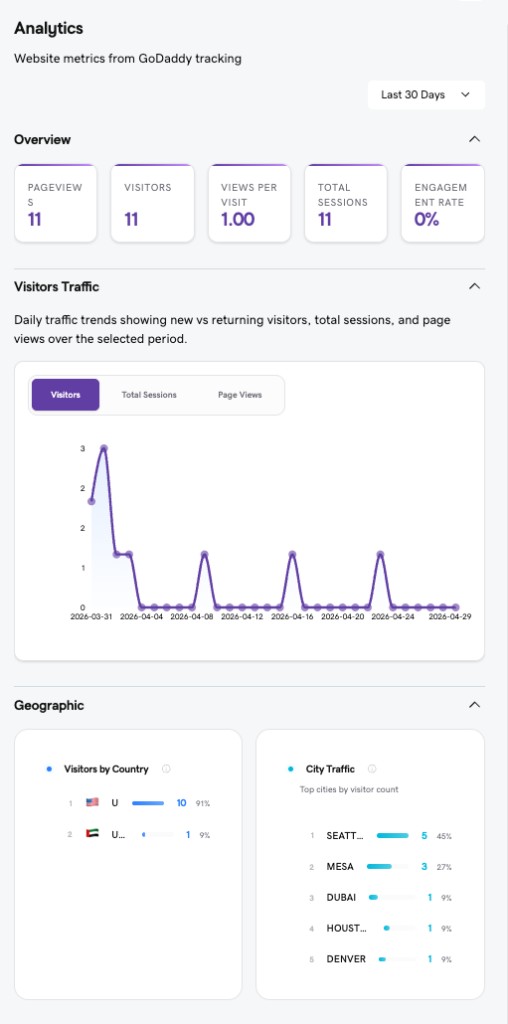
Overview
The top-level metrics give you an at-a-glance snapshot of your site’s performance:
- Pageviews - total number of pages loaded across all visitors
- Visitors - unique people who visited your site
- Views per Visit - average number of pages each visitor looked at
- Total Sessions - total browsing sessions over the selected period
- Engagement Rate - percentage of sessions where visitors interacted with your site beyond just landing on it
You can filter everything by time period (Last 30 Days is the default).
Visitors Traffic
Track daily trends for visitors, total sessions, and page views over time. The chart shows you when traffic spikes happen and whether you’re getting consistent visits or one-off bursts.
This is where you spot patterns: Did traffic jump after you shared your site on social media? Did it drop over the weekend? Are you growing week over week?
Geographic
Know where your visitors are located.
- Visitors by Country - see the country-level breakdown of your traffic
- City Traffic - drill down to the top cities by visitor count
If you’re a local business, this tells you whether you’re reaching the right area. If you’re targeting a global audience, this shows where your traction is strongest.
Devices and Traffic Sources
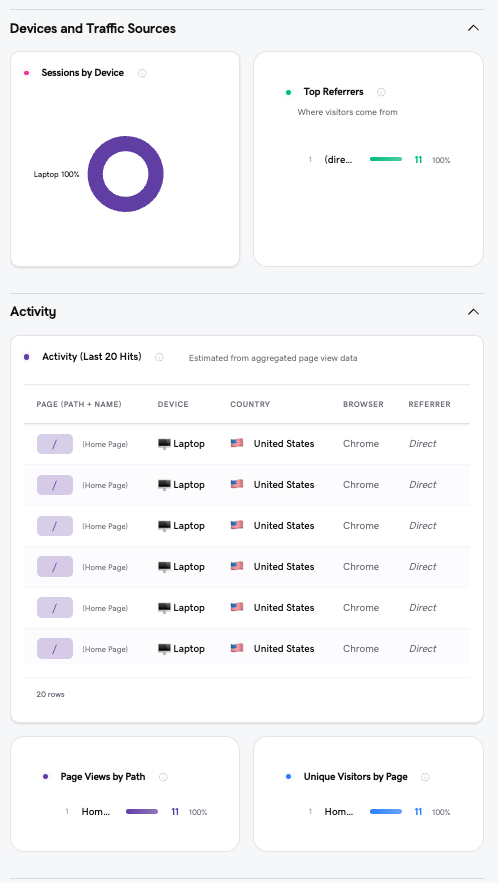
Sessions by Device
See whether your visitors are on desktop, mobile, or tablet. If most of your traffic is mobile and your site doesn’t look great on smaller screens, you know what to fix next.
Top Referrers
Where are your visitors coming from? Direct traffic means they typed your URL or used a bookmark. Referral traffic shows which external sites, social platforms, or links are sending people your way.
Activity Log
The Activity section shows your last 20 hits with detailed information for each visit:
- Page path and name - which page they landed on
- Device - what they’re browsing on
- Country - where they’re visiting from
- Browser - what browser they’re using
- Referrer - how they found your site (direct, search, social, or a specific link)
This is useful for understanding individual visitor behavior and verifying that your marketing efforts are driving real traffic.
Engagement and Content
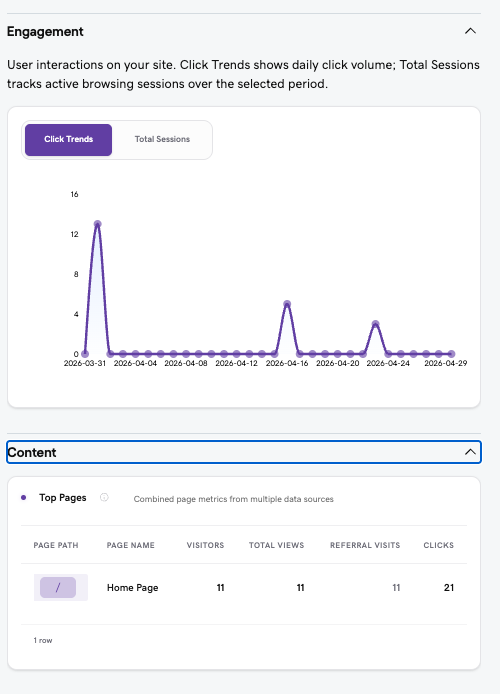
Click Trends and Total Sessions
The Engagement section shows daily click volume and active browsing sessions over time. Use this to measure whether visitors are actually interacting with your site or just bouncing.
Top Pages
The Content section ranks your pages by performance:
- Visitors per page
- Total Views per page
- Referral Visits - how many visits came from external sources
- Clicks - total interactions on that page
This tells you which pages are working and which ones aren’t getting attention. If your pricing page gets visits but your signup page doesn’t, there’s a drop-off worth investigating.
How to Use Your Analytics to Grow
The dashboard gives you the data. Here’s how to put it to work.
Validate that your marketing is working
Shared your site on social media, in a Discord community, or in an email? Check Top Referrers and the Activity Log to see if those channels are actually sending traffic. If your referrers are all “direct,” your social and content efforts might not be driving clicks yet.
Understand your audience
Geographic data and device breakdowns tell you who your visitors actually are. If 90% of your traffic is from one country and you’re targeting another, your distribution strategy needs adjusting. If most visitors are on mobile, make sure your site is optimized for that experience.
Find your best pages
Top Pages shows you where visitors spend time. Double down on what’s working: if your portfolio page gets the most views, feature it more prominently. If a page gets traffic but low clicks, the content might need a stronger call to action.
Spot trends over time
Check Visitors Traffic weekly. Are you growing? Flat? Declining? Consistent growth means your content and distribution are working. A spike followed by a drop means you got a one-time boost (like a social post) but need a more sustainable traffic source.
Decide what to build next
If visitors keep landing on your homepage but never go deeper, you might need better navigation or a clearer value proposition. If a specific page gets high engagement, consider building more content around that topic or feature.
What You Need
Analytics is available on the Starter plan and above. Publish your site, and the dashboard starts collecting data automatically. No tracking scripts to paste, no third-party accounts to create, no setup at all.
Start Building
Every site you publish with Airo AI Builder comes with built-in analytics. Build your app, go live, and see exactly how visitors interact with what you’ve created.
Start building: https://airo-builder.godaddy.com
Join the community: https://discord.gg/EfybfxAXg8
Subscribe on YouTube: https://www.youtube.com/@InsideAiroBuilder